Web Shop Logs Case Study: A Dashboard Sent Upstream in 120 Times Fewer Bytes
A web shop sends its logs to a log platform so a dashboard can show requests, latency, errors, payments and revenue, and so someone can search the lines when things go wrong. The platform charges by the gigabyte ingested and by the million lines indexed, and many of those lines are never read. In the Logs demo a log reducer sits next to the shop’s services. It learns each kind of line as it arrives, keeps every line on site for 48 hours, and sends upstream only the answers the dashboard shows, the errors and anything new.
The run covers two simulated hours of an invented outdoor gear shop, 29 September 2026 from 12:00 to 14:00 UTC, at about 39 lines a second on average. Five services write plain log lines: the web server, search, checkout, payments and login. At 12:40 the payment provider northpay fails for eight minutes, and at 13:05 a deploy makes search log three debug lines with every query.
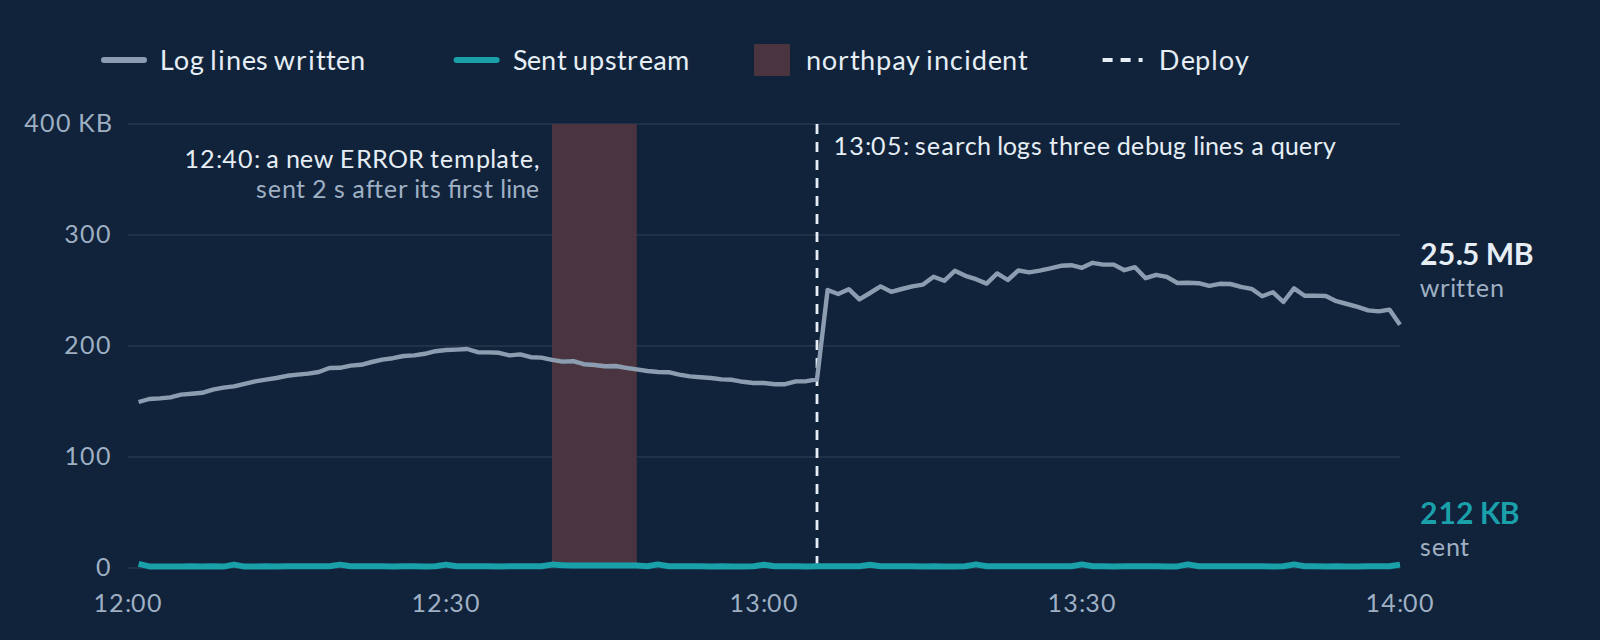
The two hours as the demo measured them: bytes of log lines written each minute against bytes sent upstream.
The Set-Up
| Web shop logs | |
|---|---|
| Services | Web server, search, checkout, payments and login, writing lines like 2026-09-29T12:00:00.600Z INFO payments charge ok provider=northpay result=ok amount=76.73 ms=289 |
| Lines | About 33 a second, 47 after the deploy: 281,164 in two hours, 25.5 MB |
| Dashboard | Six panels: requests a minute by route, p95 latency by route, errors a minute by service, payments by provider and result, revenue a minute, top searches |
| Policy | Made from the dashboard by the importer: one stream from logs per panel, every line kept for 48 hours and counted per template, error lines kept whole |
| Sent upstream | Every minute, each panel’s rows, error lines and unusual requests; every ten minutes, one example of each template; a new WARN or ERROR template as an alert within five seconds |
| Runtime | The log reducer and the Engine, compiled to WebAssembly, writing into SQLite 3.53.4’s WebAssembly build |
The whole policy comes from one command:
precomputing import shop-dashboard.json > shop.precompute
What Happened
- 12:00. Lines start. Within the first seconds the reducer has learned the common kinds of line: page views, searches, sign-ins, carts, charges and orders.
- 12:40:01. The first failed order appears in checkout, a new kind of WARN line. It goes upstream as an alert at the next checkpoint, 4 seconds later.
- 12:40:03. The first failed charge appears in payments:
charge failed provider=northpay result=error status=503. A new ERROR template, sent upstream 2 seconds after its first line. The errors panel, drawn from what was sent, shows payments failing from that minute. - 12:48. northpay recovers. Its charges go back to
ok, minute by minute, in the payments panel. - 13:05. The deploy. Search starts logging three debug lines with every query, a new template that grows to 46,734 lines. The shop now writes about 45% more lines. What goes upstream barely changes, because the dashboard never asked for debug lines.
- 14:00. The two hours end. The dashboard drawn from what was sent is checked, point by point, against a recount of the raw lines.
What the File Can Answer
The templates learned, most lines first:
sqlite> SELECT id, service, level, n AS lines, template FROM _precomputing_templates ORDER BY n DESC LIMIT 6;
id  service   level  lines   template
 2  web       INFO   107089  GET <*> route=<*> status=<*> ms=<*> bytes=<*>
19  search    DEBUG   46734  ranking batch=<*> candidates=<*> features=<*> took_us=<*>
 7  web       INFO    34227  POST <*> route=<*> status=<*> ms=<*> bytes=<*>
 9  search    INFO    33904  query q=<*> results=<*> ms=<*>
11  checkout  INFO    17110  cart updated cart=<*> items=<*>
 5  login     INFO    13888  signed in user=<*> method=<*>
The incident in the payments panel’s 1-minute windows:
sqlite> SELECT time(w, 'unixepoch') AS minute, result, n FROM payments_by_provider_result_win
   ...> WHERE res = 60 AND provider = 'northpay' AND w BETWEEN 1790685540 AND 1790686080 ORDER BY w, result;
minute    result    n
12:39:00  declined   6
12:39:00  ok        40
12:40:00  error     42
12:41:00  error     48
...
12:47:00  error     41
12:48:00  declined   4
12:48:00  ok        32
And every line is still on site. A search for northpay over all 281,164 lines finds 4,792 of them in under a fifth of a second, without anything having gone upstream.
The Numbers
| Over two hours | Result |
|---|---|
| Lines written | 281,164, 25.5 MB |
| Templates learned | 19 |
| Sent upstream | 212 KB in 124 batches and 7,896 events: 120 times fewer bytes and 36 times fewer events than the lines |
| The dashboard drawn from what was sent | 6,231 counts and sums identical to a recount of the raw lines; 840 p95 values within 1%; the top 10 searches identical |
| The incident | Caught as a new ERROR template 2 seconds after its first line |
| A month at Datadog’s list prices | About $173 with every line upstream, $4.84 with what was sent |
| Kept on site | All 281,164 lines in a 39.8 MB file for 48 hours |
| The reducer’s speed | 31,000 to 43,000 lines a second in WebAssembly in Node and 27,000 in Chromium; natively, precomputing put --lines takes the same lines in 1.8 to 2.6 seconds, 108,000 to 156,000 a second |
From a headless run of the demo’s own code with the page’s builds, and from the native binary on a two-core cloud server (Intel Xeon at 2.8 GHz). List prices checked in September 2026: $0.10 per GB ingested and $1.70 per million log events indexed for 15 days, billed annually (datadoghq.com/pricing). Everything sent upstream is counted as log events.
What the Demo Revealed
The first version of the reducer learned templates per service, whatever the level. A successful sign-in and a failed one then merged into one template with a wildcard where the level’s words differed, and a new kind of error could hide inside an old template. Templates are now learned per service and level, so an ERROR line never shares a template with an INFO line, and every new kind of error is new.
Template mining had to be trustworthy before anything could be built on it, so the Go port of Drain was checked first against the published results: on each of the 16 Loghub datasets of 2,000 lines, its grouping accuracy equals the published figure, and the average is 0.8654.
Next: On Real Traffic
In 0.1 the batches meant for upstream are read from the file with SQL, as the demo does. A forwarder that sends them, and a plug-in for the OpenTelemetry Collector, where many log pipelines already run, are the next steps on the roadmap. A pilot then answers the questions a simulation cannot: how real log formats read, and how many templates real services produce.
Try It Yourself
Open the Logs demo, press Play and watch 12:40: a new ERROR template appears within seconds and goes upstream as an alert. Then break a search shard, or search the lines kept on site for northpay. At the end, every panel is checked against the raw lines, and the file is yours to query or download.