Agent Traces Case Study: A Day of Coding-Agent Calls Kept 14 Times Smaller and Rebuilt Byte for Byte
A coding agent works by calling a model again and again, and every call sends the whole conversation so far: the system prompt, the tool list, the task, everything the agent has said and every tool output it has read. A run’s 40th call repeats its first 39. A tracer that stores each call whole stores the start of every run many times over, and the questions teams ask of those traces are simple ones: what did this run cost, which repository spends the most, and which tool fills the context.
In the Traces demo a store sits beside the agents. It keeps each message and each tool list once, under the SHA-256 of its bytes, and each call as the list of its pieces, so any call can be rebuilt exactly. Secrets are masked before anything is stored. Every call is also metered, by run, repository, model and source of its input, and each repository has a budget for the day. The run covers 29 September 2026 from 07:00 to 20:00 UTC: 100 generated agent runs on 30 invented repositories, in the fields of a public dataset of real runs. One agent gets stuck at 11:10, and three meet a secret on the way.
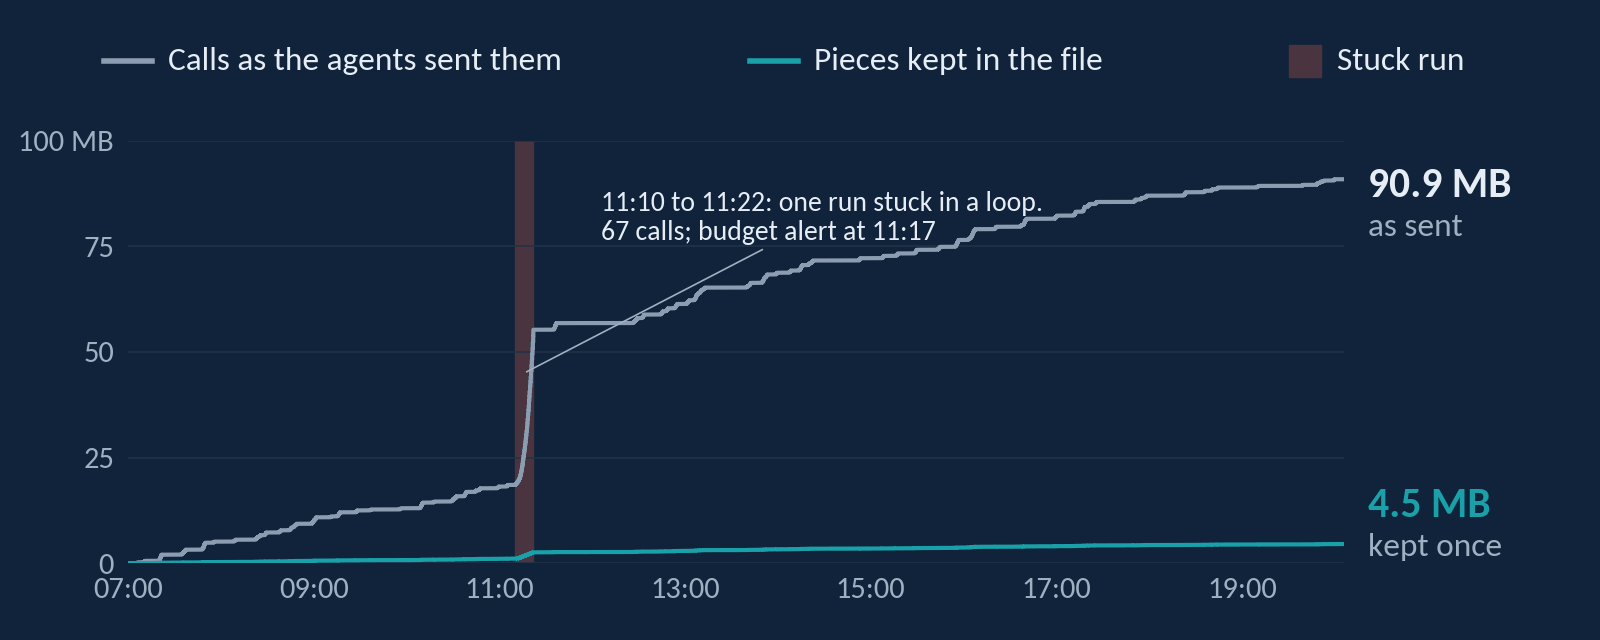
The day as the demo measured it: the bytes of every call as sent against the bytes of the pieces the store keeps.
The Set-Up
| A day of coding-agent runs | |
|---|---|
| Runs | 100, one issue each in an invented Python repository: look around, read code, reproduce the bug, edit, test, finish. 13 to 28 calls a run, except one |
| Calls | 2,045 model calls, 4,190 messages, 21.4 million input tokens and 99,000 output tokens, counted with the o200k_base tokenizer |
| Prompt cache | A call’s input is served from the provider’s cache up to the previous call’s input when that call was sent less than five minutes before: 94% of the day’s input |
| Prices | Examples: $0.40 a million fresh input tokens, $0.04 cached, $1.60 output |
| Policy | Two exact streams, one event per call and one per source of its input; cost by run, repository, model and source; a daily budget per repository as a quota |
| Store | Each piece once by SHA-256, each call as a list of piece ids with its size and SHA-256, a view that rebuilds any call; secrets masked by pattern first |
| Runtime | The store and the Engine, compiled to WebAssembly, writing into SQLite 3.53.4’s WebAssembly build |
The meter is a short policy:
stream calls exact {
  id     call_id refuse repeats 7d
  key    repo text
  key    run text
  key    model text
  value  input_tokens integer
  value  cached_tokens integer
  value  output_tokens integer
  derive cost_nano = (input_tokens - cached_tokens) * 400 + cached_tokens * 40 + output_tokens * 1600
  period day close 24h
  raw    until closed + 30d
  rollup 1h keep 400d
  rollup 1d keep forever
}

precompute repo_cost_day = sum(calls.cost_nano) by repo per day
quota repo_budget = repo_cost_day
What Happened
- 07:05. The first reply comes back. Runs start through the day, about one every eight minutes, and each takes one to two and a half minutes.
- 08:47. An agent lists the environment variables. The output holds an AWS key id and secret key, and both are masked before the call that carries them reaches the file.
- 11:10. An agent on tallowcraft/tarnforms fixes its bug, then starts running the whole test suite verbosely, again and again.
- 11:15. The run has made 40 calls in six minutes, and each call now sends 144,000 tokens.
- 11:17:06. Call 45 takes the repository past its budget of $0.20 for the day. The
repo_budgetview says so at the next checkpoint. A gateway that reads it before each call would stop the run here. - 11:22. The run finishes after 67 calls and $0.46, about 46 times the median run. Its last call sends 338,305 tokens.
- 13:50 and 17:11. Two more secrets: a GitHub token in a git remote’s URL and an API key in a local settings file. Both are masked.
- 20:00. The day ends. Every call is rebuilt from the file and compared with the request as sent, and every cost is checked against a recount.
What the File Can Answer
Spend against the budgets, with the limits the demo sets:
sqlite> SELECT repo, round(used / 1e9, 4) AS usd, round(lim / 1e9, 2) AS budget, reached
   ...> FROM repo_budget ORDER BY used DESC LIMIT 4;
repo                       usd     budget  reached
tallowcraft/tarnforms      0.5129  0.2     1
fernwick/tarnsync          0.0839  0.2     0
tallowcraft/lumentime      0.0613  0.2     0
saltmarsh-io/thistleparse  0.0578  0.2     0
Where the money goes. Tool output fills the context: the shell’s and the file editor’s output cost more than everything else together, while the model’s replies are 11% of the day.
sqlite> SELECT source, round(value / 1e9, 4) AS usd FROM source_cost_day ORDER BY value DESC;
source                   usd
tool:execute_bash        0.5005
tool:str_replace_editor  0.4951
output                   0.1584
tools                    0.1032
system                   0.1017
assistant                0.0732
task                     0.0231
tool:think               0.0003
And any call, rebuilt from its pieces with SQL alone. The stuck run’s calls grow as it goes, and the store wrote down each one’s size and SHA-256 when it kept it:
sqlite> SELECT seq, time(ts, 'unixepoch') AS utc, input_tokens, request_bytes, request_sha256
   ...> FROM trace_calls WHERE run = 'generated-0046' AND seq IN (1, 20, 45, 67);
seq  utc       input_tokens  request_bytes  request_sha256
1    11:10:04  1932          8708           d05e1a3f10aa7ac616e1895e6f44e9ee312fa6defe2b189afcd79b46b22de277
20   11:11:33  11363         47240          3a694f80e0fd7d382277ef82fbb8909895cbb74d49327a5b7a1e475b2aaae5ae
45   11:17:06  181857        785914         cd0a6e2407c0a554c045d98f9979b72675aec52503a1713384ea24d12bfb4e53
67   11:22:01  338305        1463567        20ead9eedadaf2d286a38d9cf02c303174b3bda4d5927dc1cd346f82cfe0072e

sqlite> SELECT length(request) FROM trace_requests WHERE call_id = 'generated-0046#67';
1463567
The Numbers
| Over the day | Result |
|---|---|
| Calls as sent | 90.9 MB for 2,045 calls |
| Kept | 4,092 pieces, 4.5 MB. With the calls table and the indexes, the trace tables take 6.5 MB on disk: 14 times smaller |
| Rebuilt | All 2,045 calls rebuilt from the file are the requests as sent, byte for byte |
| Secrets | 4 planted in 3 runs, 4 masked, none left in the file |
| Cost | $1.46 for the day. Every run, repository, source and model equal to a recount to the billionth of a dollar, and the two streams give the same total |
| The stuck run | 67 calls, 8.3 million input tokens, $0.46. Its repository passed its $0.20 budget at call 45, and 46 calls came after the alert, 22 of them in the same run, for $0.30 |
| A run reported twice | Every call refused as a repeat by the exact streams, costs unchanged |
| Speed | 875 to 989 calls a second in WebAssembly in Node over four runs, with a checkpoint every minute of the day. Natively, precomputing traces keeps the whole day in 0.8 to 1.0 seconds |
| Native against the browser | The native file equals the browser’s: 19 tables, 40,043 rows, 231,641 values. Only the demo’s budget limits are left out |
From a headless run of the demo’s own code with the page’s builds, and from the native binary on a two-core cloud server (Intel Xeon at 2.8 GHz). The runs, their token counts, their times and the prices are generated or modeled, as described above.
What the Demo Revealed
The first version of the store ran its secret patterns over nearly every message, and the regular expressions took most of its time. Each pattern now has a quick test first, such as a word every match must contain, and a message that fails every quick test is stored without running any pattern. That doubled the store’s speed. A quick test that skipped a real secret would leak it into the file, so a test masks 20,000 made-up texts, built from pieces of secrets, with and without the quick tests, and requires the same result.
Most of the day’s input comes from the cache, so what costs money is new text: each tool output, paid in full once and then at the cached price in every later call. That is why the stuck run is expensive. Each loop adds a long test report that every following call carries.
Next: Real Runs
The generator writes runs with the fields of nebius/SWE-rebench-openhands-trajectories, and the prototype includes a script that reads one of its Parquet files, so the same demo runs on real agent runs, credited to Nebius under CC BY 4.0. After that comes a hook in the agent’s path, so each call reaches the store as its reply comes back. The roadmap has the rest.
Try It Yourself
Open the Traces demo, press Play and watch 11:10: the stuck run climbs the costliest-runs table, and its repository’s budget bar turns red at 11:17. Report a finished run again and see the meter refuse it, then rebuild any call and compare its SHA-256 with the request as sent. At the end every call and every cost is checked, and the file is yours to query or download.